
Generally, Individual Advised business continues to show higher admittance rates than Individual Non-advised for the same cover type, according to the latest APRA statistics.
APRA’s Life insurance claims and disputes statistics publication notes this higher admittance rate could be due to the policyholder having clearer expectations up front of what is covered by the product. “…or (related to the previous point) the adviser discouraging the policyholder from lodging a claim that is not covered by the policy.”
The biannual publication presents the key industry-level claims and dispute outcomes for 18 Australian life insurers writing direct business to June 2022 (see: Life Insurance Claims Data Continues to Show Value of Advice).
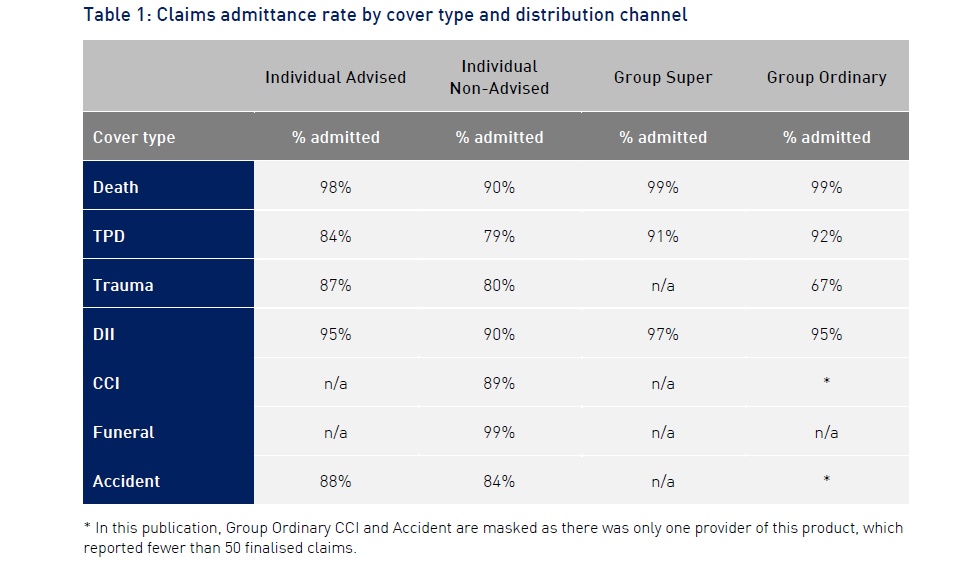
APRA’s table, comparing claims admittance rate by cover type and distribution channel, shows that Individual Advised death cover was admitted at 98% (Individual Non-advised at 90% but Group Super and Group Ordinary both at 99%).
TPD cover for Individual Advised was at 84%, lower than the 91% and 92% for Group Super and Group Ordinary but higher than Individual Non-advised which stood at 79%.
Trauma claims admittance for Individual Advised stood at 87% (80% Non-advised) with DII at 95% (90% Non-advised) and Accident at 88% (84% Non-advised).
ARPA notes the table above reveals significant variance in claims admittance rate between different cover types and distribution channels. It says these results are affected by a number of observations with one combination only reflecting 12 finalised claims, whereas 14 out of the 20 combinations have more than 1,000 claims.
In its industry highlights the authority says that the admittance rates by channels, for years ended June 2018 to June 2022, across all distribution channels have remained relatively stable over time.

However, the claims paid ratios by channels, over the same period, for Individual Advised and Group Super business have been trending downwards since December 2020.
APRA says that in contrast, the ratios for Individual Non-advised and Group Ordinary business continued to rise over time.
…Individual products tend to have lower claims paid ratios due to higher acquisition costs…
It says that compared to Group products, Individual products tend to have lower claims paid ratios due to higher acquisition costs associated with the policy.
“As this is reflected in the premium charged, the claims payments for these products will generally be a lower percentage of the premium income.”
The authority urges caution in using the claims paid ratio as a measure of consumer value or product profitability. For insurers, claims payments are only one part of the costs associated with an insurance policy. Other costs, such as administration, acquisition costs and claims reserves, are not included. Whether, and how profitable, the product is to the insurer will also depend on these factors.
Looking at claims paid ratios by cover types, for year ended June 2018 to June 2022, APRA says the claims paid ratios for Death and Trauma declined steadily over time.
“In contrast, the ratios for TPD and DII peaked in December 2020 before returning to a lower level of 70% to 80%.”
Of dispute lodgement ratios by channels, for the four years to June 2022, APRA says the ratios for all distribution channels remained relatively stable over time “…except Individual Advised business. The increase in the latter was mainly driven by DII, given the various repricing activities undertaken to address the product sustainability issues.”
APRA also notes that a selection of the published data is available in a consumer-friendly format on ASIC’s MoneySmart website.

